Traffic Report Overview
The Traffic Report is a feature that allows you to monitor the traffic volume of various resources.
Currently, the following resources can be monitored:
- Physical Port (Includes LAG Ports)
- Virtual Circuit Interface (VCI) (*Ingress only: incoming traffic to the Physical Port in use)
For detailed instructions on how to view reports, please refer to the Procedure for Viewing Traffic Reports at the bottom of this page.
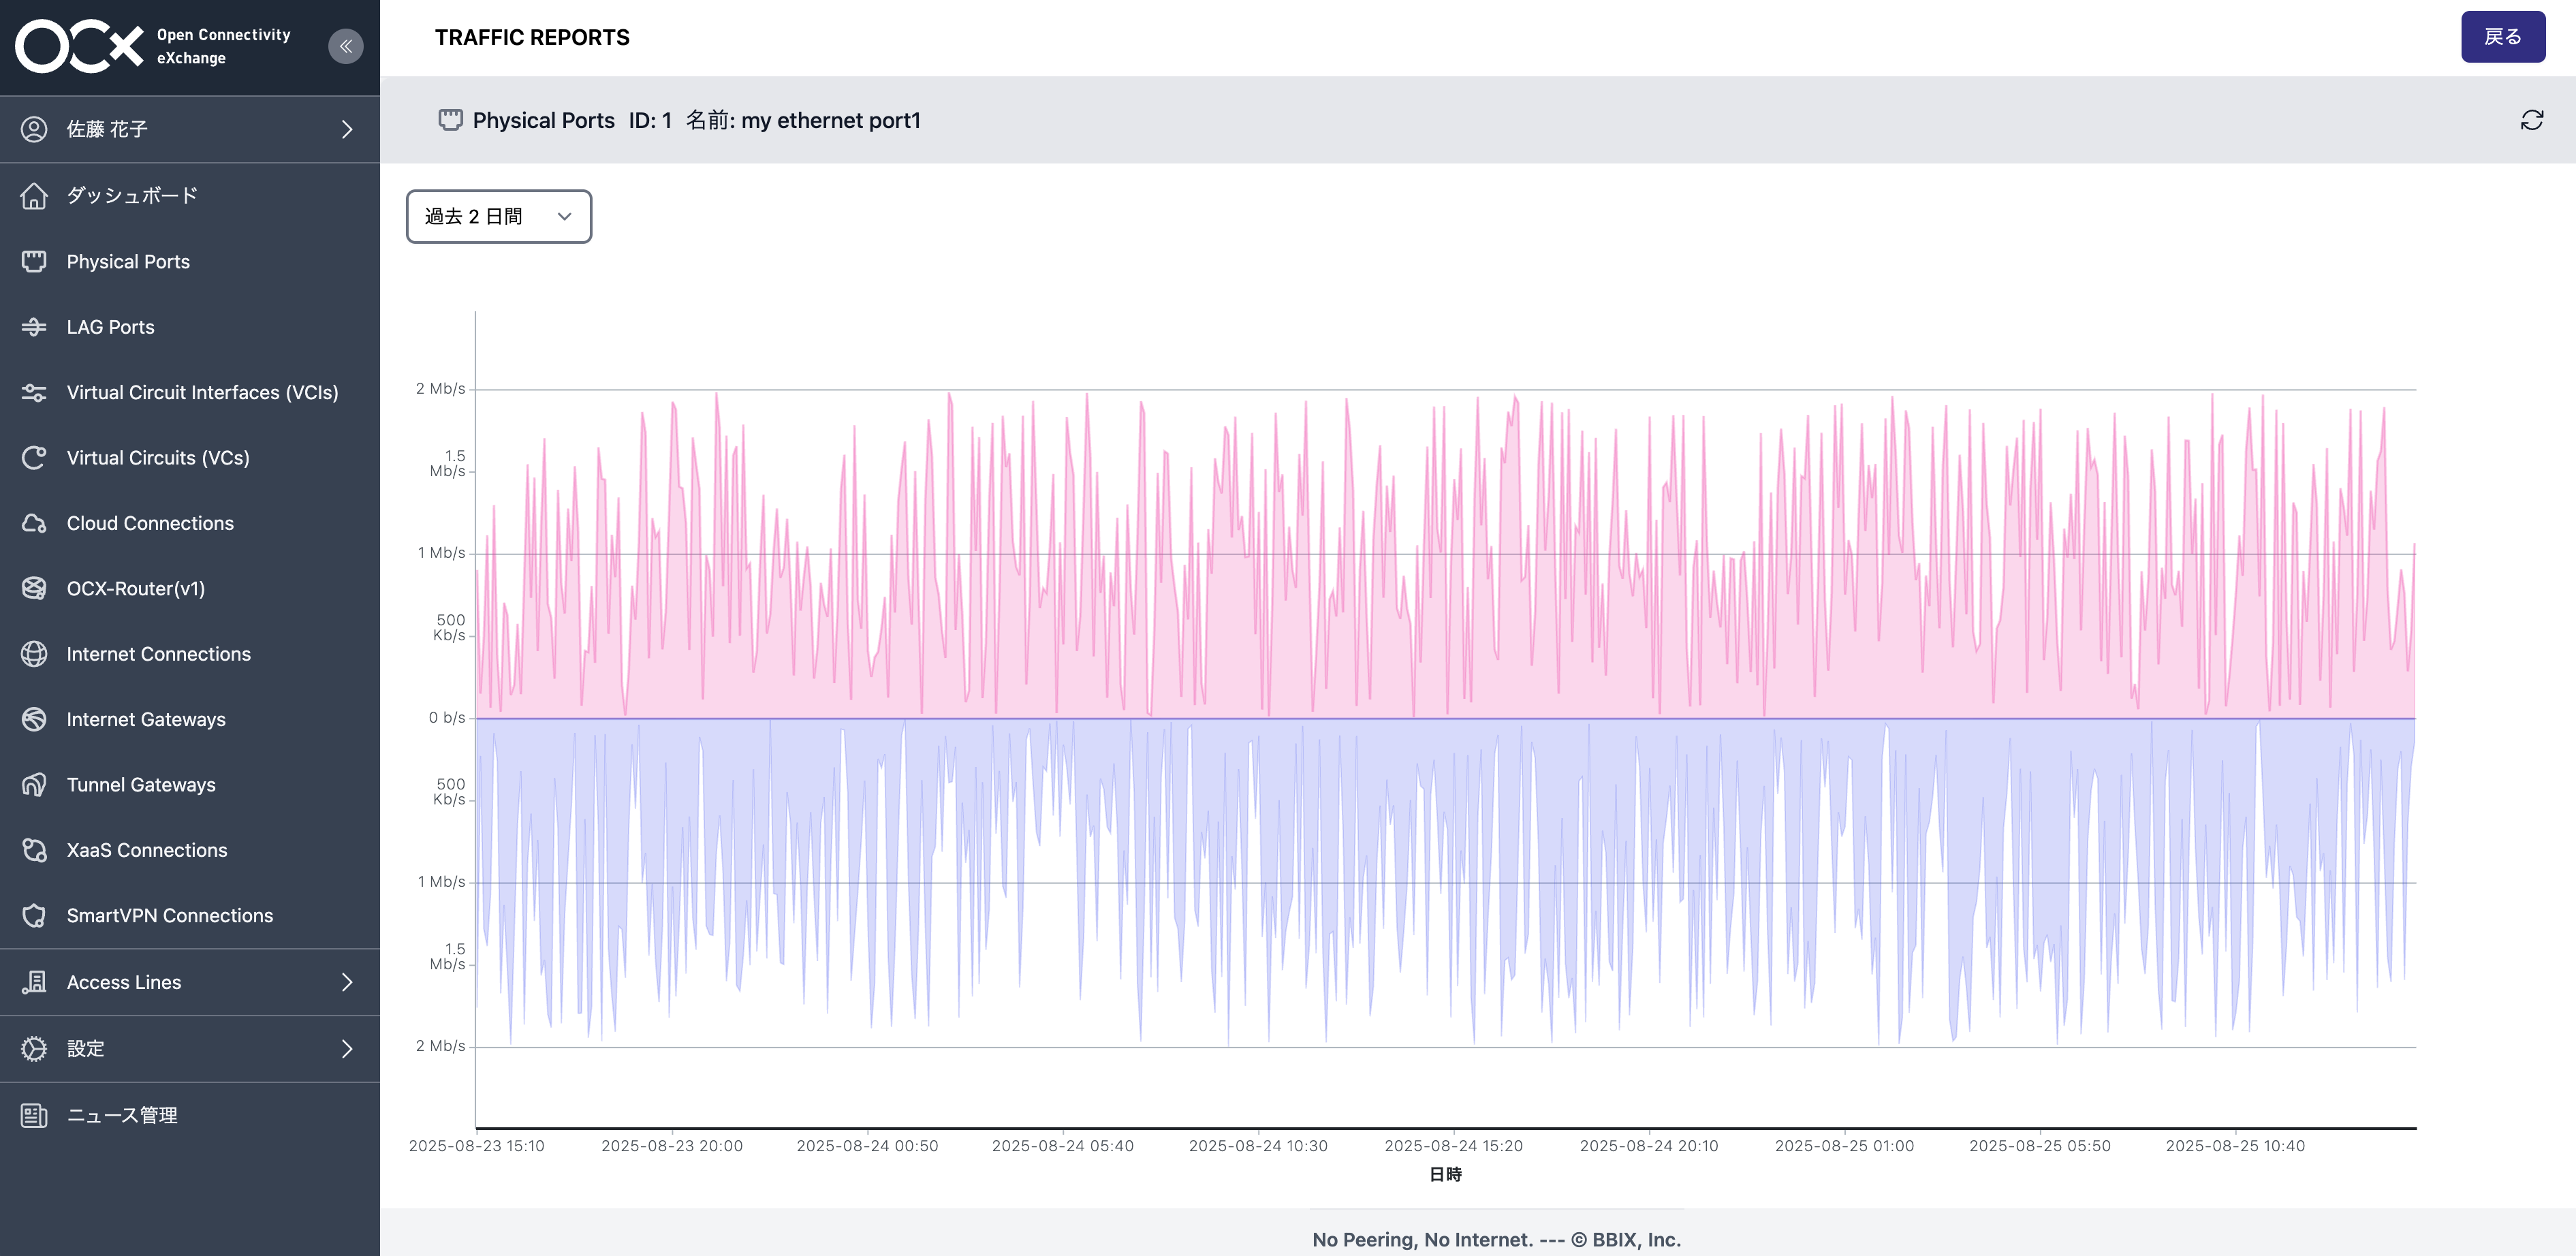 Note: In the graph, the values displayed at the top represent incoming traffic (Ingress) to your Physical Port, and the values at the bottom represent outgoing traffic (Egress) from the Physical Port.
About Traffic Report Plus (Paid Version)
Traffic Report Plus is a paid optional service that expands the functionality of the standard Traffic Report. It provides additional features such as a 365-day graph display, a custom period selection tool, and CSV data download capabilities.
For more details, please refer to the Traffic Report Plus Overview.
Traffic Report Specifications (Free Version)
- The viewing period for each resource's Traffic Report is available from the time the resource is created until it is deleted.
- The selectable display intervals are 2 days, 7 days, and 30 days.
Traffic Calculation Method
- The bps values on the graph are calculated based on data intervals of 5 minutes.
- For VCI, traffic volume is calculated based on sampled data; therefore, there may be discrepancies with actual traffic volume.
-
The sampling rate is
1/1024. The relationship between traffic volume, average packet size, and potential error margin is shown in the table below:Error Margin (%) Average Packet Size (Bytes) Traffic Volume (bps) 500 600 700 800 10M 7.24 7.93 8.57 9.16 100M 2.29 2.51 2.71 2.90 1G 0.72 0.79 0.86 0.92 10G 0.23 0.25 0.27 0.29
-
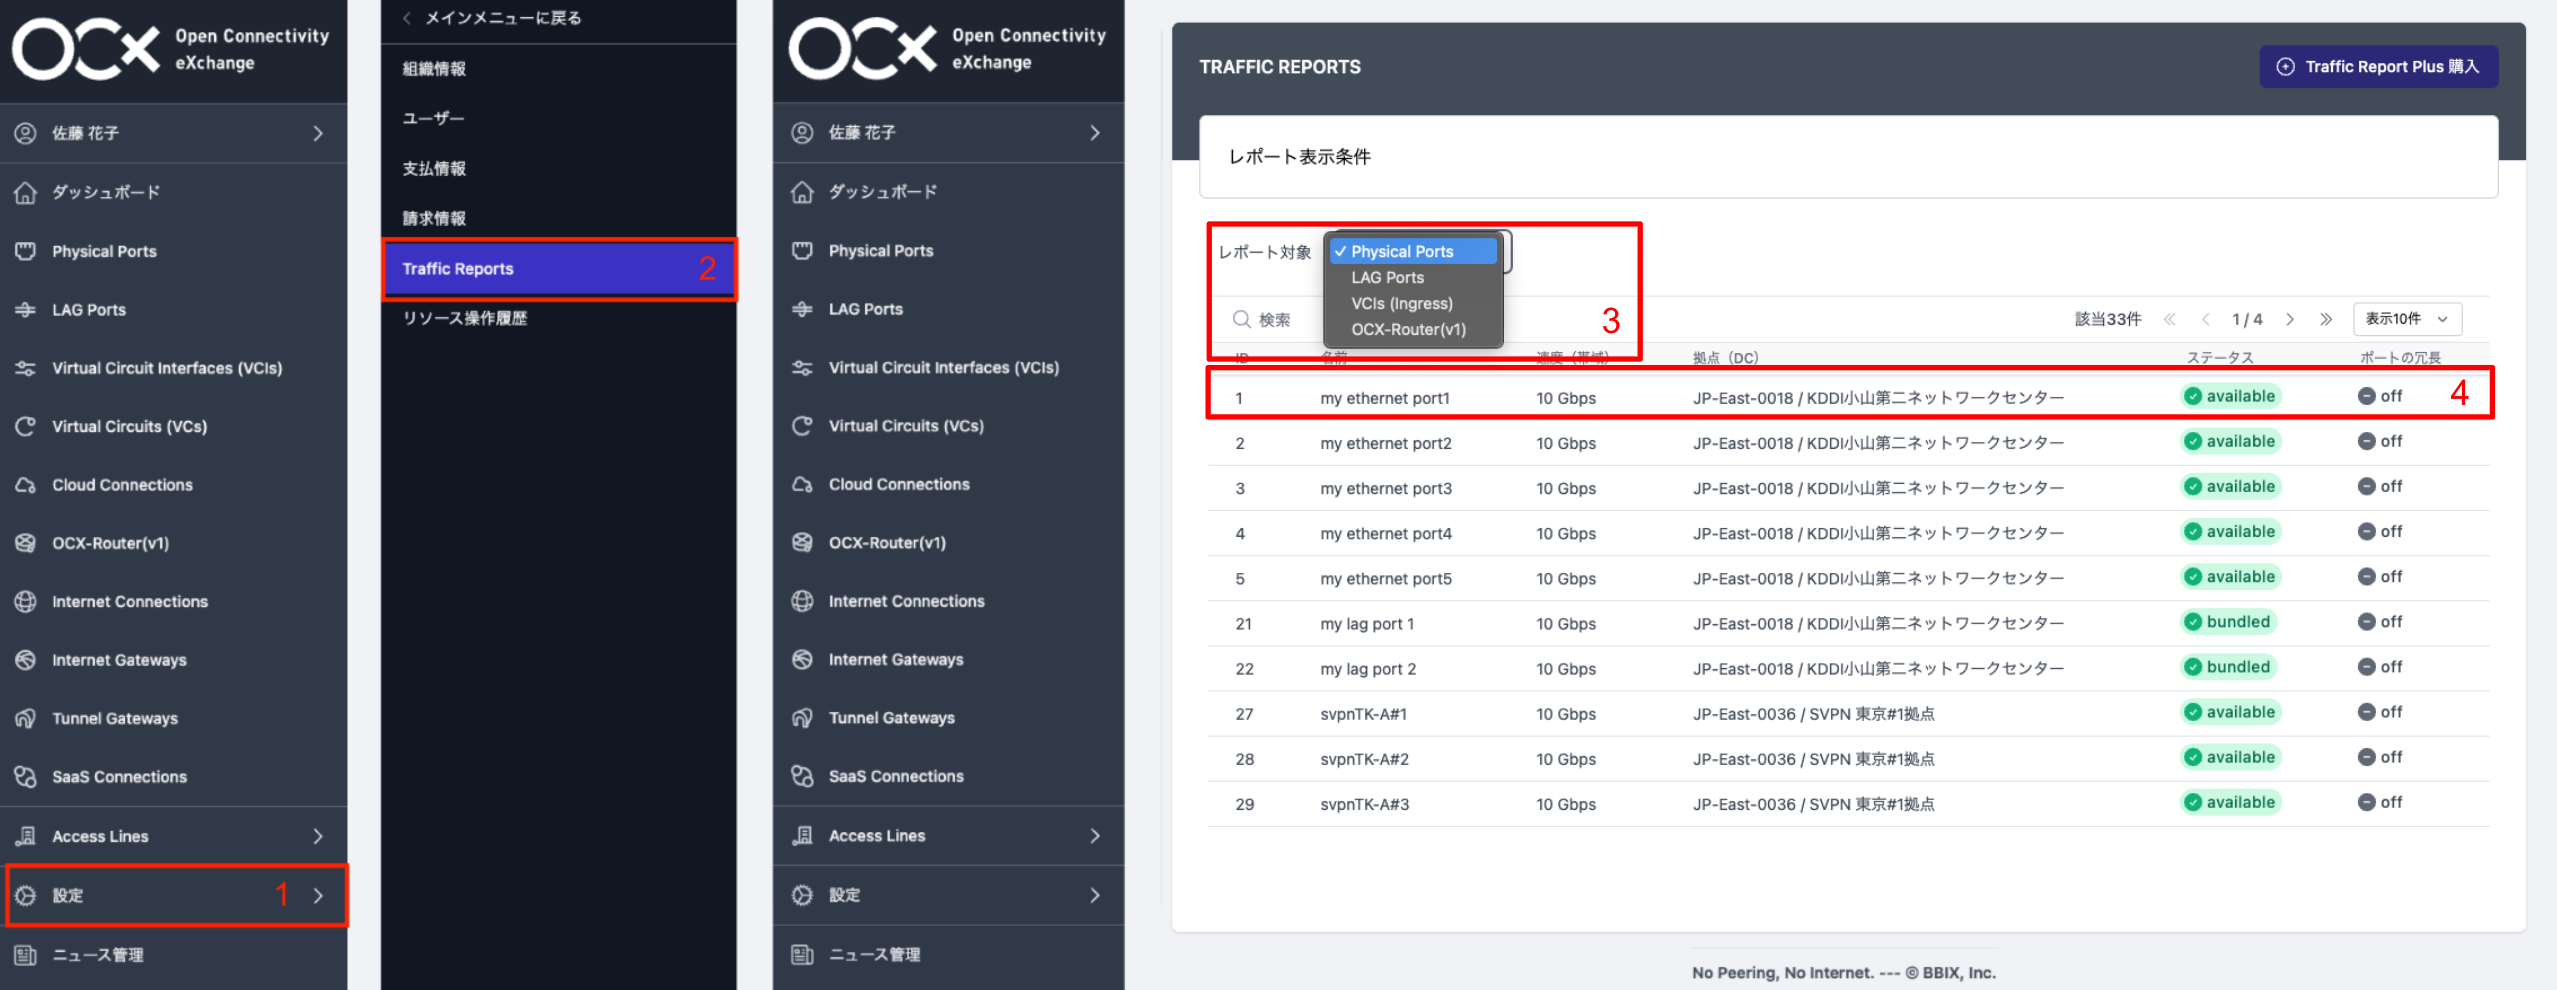
Procedure for Viewing Traffic Reports
- Log in to the OCX Portal.
- From the left navigation bar, click [Settings] > [Traffic Reports].
- Select the type of resource you wish to display.
- A list of selected resources will appear. Click on the specific resource you wish to check to view its traffic volume.